
Hello there cyber fanatics!
Today I have a somewhat of a good old malware analysis technical blog!
As part of many modus operandi of malwares and malware authors, they apply many types of evasion and malware analysis techniques.
One of the most common ways malwares look to evade these techniques are by Anti Debugging.
Anti-debugging refers to a set of techniques and measures employed by malware developers to detect and thwart attempts to debug, analyze, or reverse engineer their activities.
In this blog, I will explain the fundamentals of anti-debugging as they are performs using various functions in the OS. although there are extensive ways to evade identification, this blog will be about the more basic ways and how we, as malware analysts can identify it, and bypass this technique.
In addition, I will apply the technique myself so we can see how it works from an attack perspective.
Anti-Debugging Basic Functions
As mentioned, the basic form of anti debugging is by using OS function that will indicate that the malware’s process is attached to an debugger of any kind.
A common anti-debugger nd the one we will use this blog is x64dbg.
There are several debugger indicators that malware authors might looks for in the victim’s machine as part of their deployment. Here are the most common ones:
IsDebuggerPresentIsDebuggedNtGlobalFlagsQueryInformationProcessCheckRemoteDebuggerPresentSetInformationThreadDebugActiveProcessQueryPerformanceCounterGetTickCountOutputDebugStringSetUnhandledExceptionFilterGenerateConsoleCtrlEventSetConsoleCtrlHandlerSetThreadContext
On this blog we will talk about the IsDebuggerPresent although i will release some more blogs about the rest of the functions and check some cool new ways to do so other than calling the functions in plain.
IsDebuggerPresent
This function determines whether a calling process is being debugged by a user-mode debugger. This function allows an application to determine whether or not it is being debugged, so that it can modify its behavior.
The IsDebuggerPresent is a function that is a part of the Kernel32.dll file. so pretty much it is available to any process that runs on our Windows OS. Its functionality is fairly simple, and as I said, it checks if the running process is executed in the context of a debugger.
The returned value is it does is a nonzero value, which means it is being used in a Boolean matter. You can read the entire documentation in the following Microsoft page: https://learn.microsoft.com/en-us/windows/win32/api/debugapi/nf-debugapi-isdebuggerpresent
Example
When you write a mechanism in your code that checks for an attached debugger in C, we will use the library Windows.h, here is a quick code example for a C program that checks whether it is being debugged. In case it does, it will end the program with a return value of 1.
#include <stdio.h>
#include <Windows.h>

int main(){
	if (IsDebuggerPresent()){
		printf("Debugger detected!\\n");
		return 1;
	}
	else{
		printf("No debugger detected.\\n");
	}
	return 0;
}
The code is pretty straight forward and shows how we can decide what to do in our program and how to use the IsDebuggerPresent function.
When compiling this code and running it on terminal, i.e, not with an attached debugger, the code will run and exit with a return code 0:
x64dbg debugger also creates a console, next to the assembly mapping, for us to get the output of our program. When pressing the blue play button on the top toolbar, and for now without creating any breakpoints, the output the we will receive will be as follows:

As you can see, the IsDebuggerPresent function returned a nonzero value, which indicates that the program is in fact being executed through a debugger. It than prints the “Debugger detected!” string and exit with an exit code 1.
Bypassing The Debugger Check
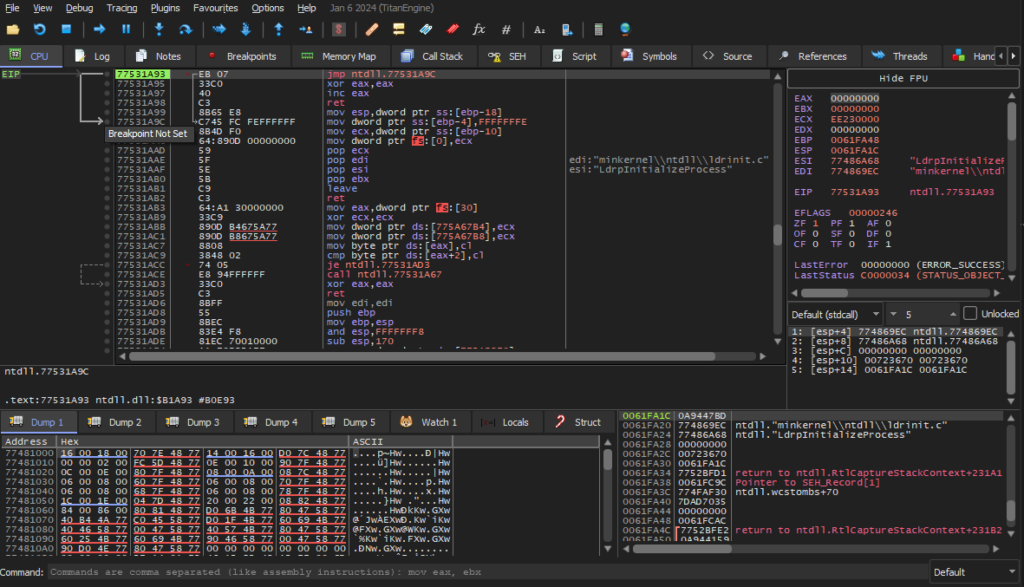
So dealing with this type function demand to get our hands dirty with assembly. going back to the x64dbg debugger, we have the ability to set up a breakpoint to the instruction in the code that calls for the IsDebuggerPresent.
In order to do so we will go to the Breakpoints tab:

As you can see, on the left modules list, we have a list of all DLL files that we imported to our executable. We will choose the kernel32.dll file from the list, and we will have all the functions in it and their addresses. Now as you already know, the IsDebuggerPresent function in included here so we will find it among all other functions:
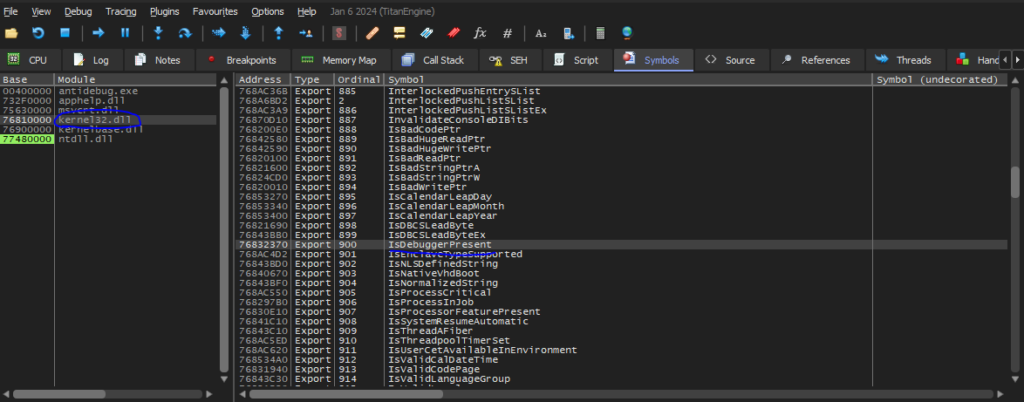
To set up a breakpoint for this function we will right click on it choose “Toggle Breakpoint” or just press the F2 button – You do you.
Now let’s go back to the assembly code and press the play button again. This time, we will stop on the call to the IsDebuggerPresent function:
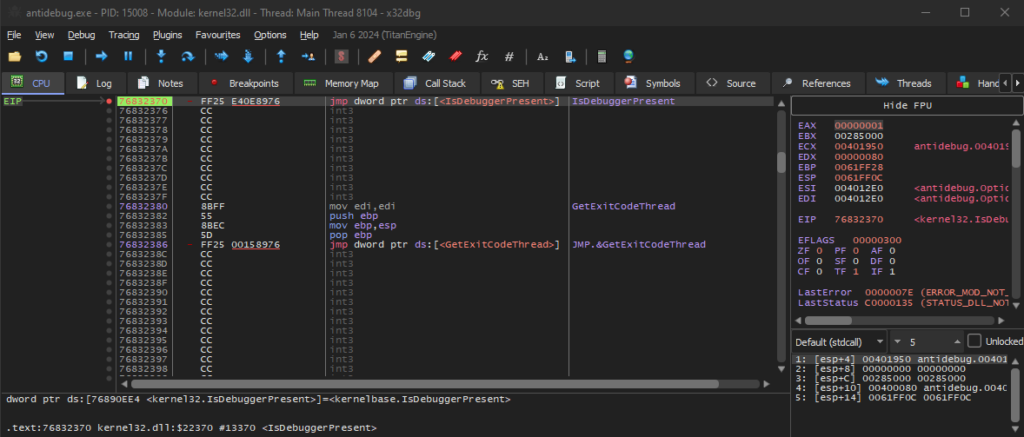
This part is a bit technical, when calling the IsDebuggerPresent function, we will receive a value in return, either it is a 0 in case we don’t or another value if we are attached to the debugger – which we are.
In order to run the function carefully, we will not use the play button but the “Step Over” button:

The IsDebuggerPresent function, loads the answer into our eax register which means that if we look at the value of eax we can see the answer before the check happens:
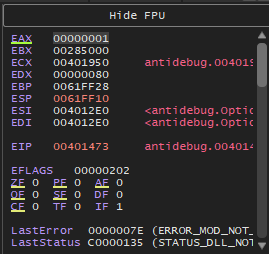
You can see that the eax register’s value is set to 1, ie the IsDebuggerPresent function returned 1. Luckily, we can change the value before the je check in the previous figure on line 00401475, this check is the actual check we did here:

By double clicking on eax value, we can change it to 0 so it will look like so:
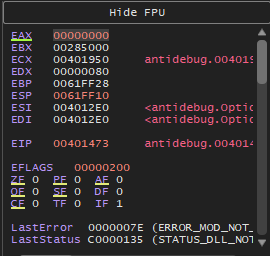
Now we have committed a bypass to what the IsDebuggerPresent function returned.
The je check failed and we moved to the part of the code that performs normally and prints “No debugger detected.”:

When stepping over another command, we can see that the program printed it in our console, which indicates our bypass is successful and we can continue to see the program works as it was intended.

Detection
In some cases, we can detect a use of a particular functions in an executable only by static analysis of its strings. The problem here is that if we do so, given that almost all executables use the Kernel32.DLL file, it will probably appear in any executable we will check. So the way for us to verify the sample is doing anti-debugging is, well, by debugging it.
Conclusions
Malware analysis, especially when you need to disassemble the code and look in the assembly code, is not an easy task, we need to know what to expect and what are we looking for.
I am no expert and certainty not a reverse engineer, but this type of blogs help me improve my knowledge through teaching and sharing what I know.
There are many ways to perform anti-debugging, much more complex than this, and although it is very simple, it is still being used sometimes these days as well.
I will create more blogs shedding some light on malware analysis techniques including this one. I hope I was able to improve 0.1% of your knowledge.
Have fun! and good luck!
